To tell the program what we'd like charted, you can change or create a new category list.
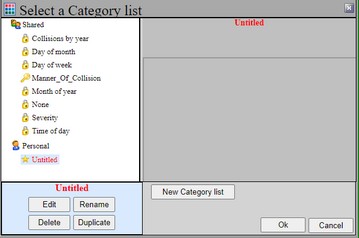
To change the chart category list while viewing a chart, Click the far right category list button on the bottom of the page ![]() . Here you can select an existing category list to build a chart from or Create a new list.
. Here you can select an existing category list to build a chart from or Create a new list.
In this example we will create a new category list. Click the New Category list button. An 'Untitled' name will appear under your Personal account that can be edited.
Click on the Edit button with 'Untitled' selected.
Here we can define a category from almost any of the fields in the database. Click the button on the lower left to "Fill category list". Choose the field that indicates your lighting condition. If you don't have that, choose your weather field. (we're intentionally choosing "categorical" fields in this step. Charting "continuous" data, such as age or speed, is an advanced subject)
Click the Ok button. This will populate default "bins" for this field. "Bins" are Crash Magic's term for the containers that hold each category of data. They will be represented as bars, pie slices, or lines. The name of the database field is populated as the name of the Category list.
Click the "Save and return" button to return to the category list selector. The new category list should be selected by default, if you would like you can click on the rename button and give it a different name like 'Lighting' or 'Weather'. Click the OK button to close the selector, and your chart will be displayed.