Another way of displaying data is using a chart. Charts can be created using any field in the database. Let's create a chart. To do this, click the chart button ![]() at the top of the project tree. This will bring up a list box to select a chart from. There are several charts already prepared for you under the Shared directory. Choose the Day of Week chart, and hit the OK button.
at the top of the project tree. This will bring up a list box to select a chart from. There are several charts already prepared for you under the Shared directory. Choose the Day of Week chart, and hit the OK button.
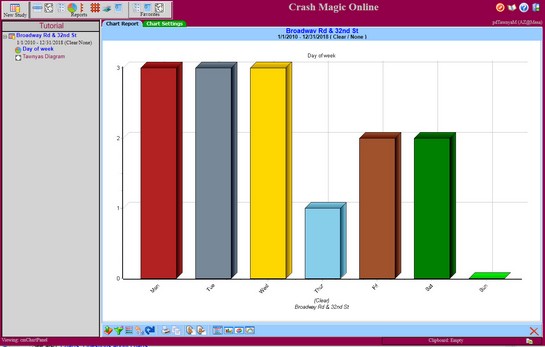
This will bring up a Day of Week chart for the study that you've been working in.
See also: Charts, Questions about charts