Templates contain all the settings of an item such as a report. These settings can then be loaded anytime they are desired. For example, one might create a day of week chart. Then, that chart might be ordered by day, and then the colors set specifically. (i.e. Blue for Mondays, green for Tuesdays, etc.)
Earlier in this tutorial we created a chart. To get started let's select that chart. Locate the chart in the project tree and click on it. Let's create a template for this chart so that we can use it again in the future. To do this click on the save template ![]() button on the bottom of the screen. You will now have the save template dialog box on the screen.
button on the bottom of the screen. You will now have the save template dialog box on the screen.
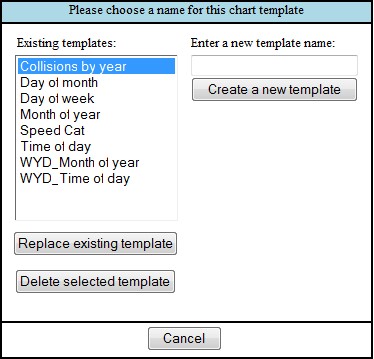
Under existing templates you will see a few chart templates provided by Pd' Programming, as well as any prepared for your group. To save this chart as a new template, type "My First Chart" under "Enter a new template name" and click the "Create a new template" button.
Next, we are going to create a new chart. Click the new chart button ![]() at the top of the project tree. Just like the first time you created a chart, Crash Magic has made a default chart for you. We can now apply the template you saved to this new chart. Click on the load template button
at the top of the project tree. Just like the first time you created a chart, Crash Magic has made a default chart for you. We can now apply the template you saved to this new chart. Click on the load template button ![]() at the bottom of the screen to bring up the list of existing chart templates.
at the bottom of the screen to bring up the list of existing chart templates.
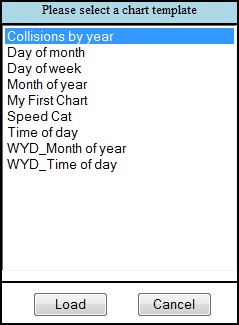
You will see once again that this box is populated with several of the charts provided with Crash Magic, but you will also see a new entry "My First Chart". Select "My First Chart" and click "Load". You should now have a chart that looks identical to the saved chart. This template will work for any chart in any study, so you can spend some time creating a very nice looking chart and reuse it many times.
This chart template is just the tip of the ice burg. Templates can be applied to studies, reports, filters, lists, etc.
See also: Templates