Crash Magic uses a "schematic" to assign each crash symbol a location, and to display the appropriate curb lines. Schematics are available to represent a variety of intersection and corridor types. Schematics are selected from the settings tab. Click on the green "Diagram Settings" tab at the top of the diagram now.
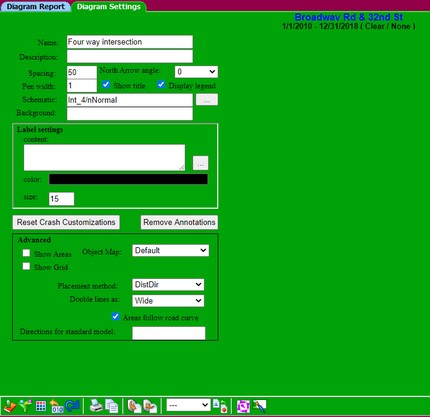
The settings tab contains a number of options for formatting your collision diagram. One of those settings is the schematic selection. The schematic that you want to use depends on the type of location you have specified in your study. If you have selected data from an intersection, you can choose from a variety of intersection schematic types. If you have selected data gathered from a corridor, you should choose a corridor schematic.
If you gathered data for an intersection:
1. Open the list of available schematics by clicking on the ![]() and select the "Int_4/1_Turn/E_Bound" schematic. This schematic represents a 4 leg intersection with 1 turn lane in the East-bound direction. Now click on the "Diagram Report" tab to return to the diagram. The new diagram will depict the intersection using the selected schematic.
and select the "Int_4/1_Turn/E_Bound" schematic. This schematic represents a 4 leg intersection with 1 turn lane in the East-bound direction. Now click on the "Diagram Report" tab to return to the diagram. The new diagram will depict the intersection using the selected schematic.
2.Now, go back to the Diagram Settings tab and change the schematic to "Int_4/nNormal", the default schematic. Click on the Diagram Report tab to return to the collision diagram.
If you gathered data using a Route-milepost study:
1. Open the list of available schematics and select the "MilepostEW" schematic. This schematic represents a corridor where the mileposts increase as they proceed East to West. Now click on the "Diagram Report" tab to return to the diagram. The diagram is now displayed as a corridor with crashes grouped into areas based on how far along that corridor they occurred.
2.Now, go back to the Diagram Settings tab and change the schematic to match the data you requested. This will be one of the Milepost?? options. Click on the Diagram Report tab to return to the collision diagram.
If you gathered data by another method, you will need to identify an appropriate schematic to render that data. In cases where your data is gathered in a unique manner, you may have some custom schematics. For example:
Oregon DOT:
1. Open the list of available schematics and choose the "OR/INT_4/N_E_S_W" schematic. These schematics were created specifically to address the DOT's data which contains specific direction information for each of the streets. (up to 8 possible directions for each leg) Now click on the "Diagram Report" tab to return to the diagram. The diagram is now displayed as a simple 4 leg intersection.
2. Now, go back to the Diagram Settings tab and change the schematic to match the data you requested. This will be one of the OR/INT_?/??? options. Click on the Diagram Report tab to return to the collision diagram.
See also: Schematics