In order to generate a report, you must first decide on the data you would like the report to display. Perhaps you are looking for all the crashes at a particular intersection for the past year. Or, you might be looking for the crashes that occurred on a particular stretch of highway. Depending on how you would like to gather your data, you will need to select a particular "study type". Start by clicking on the "New study" button above the project tree.
![]()
The study settings panel will be displayed for you to select your desired study type and pick criteria for it to use while gathering data. For example, an intersection study will require a date range and two street names. A route milepost study will require a date range, route name and starting and ending milepost. From the 'Type' drop down list, choose an intersection, node or route-milepost section with a sampling of crashes available.
Note about available study types: Crash Magic supports many types of studies. Your installation of the software has been customized to show templates for studies that can be supported by your data. For example, as a local agency with no rural roadways, you may not have a "milepost" field. In that case, your configuration will not include a "route milepost" study template. However, you are likely to have an "Intersection" or "Address" study template. Possible study types are, Date Range (by date), Case Id (list by number), Intersection (by 2 streets), Route Milepost (by street and milepost), Address (by street and address), X Y Rectangle (by Latitude and Longitude), and Node (by node number).
Depending on your choice of study type, you will now be presented with several properties to fill in such as street names, dates, etc. Fill in those properties. Once you have everything filled in, you may hit the blue update arrow to show how many crashes that you have within the study you just created. If you've got values (other than 0), you're good to go. If not, return to the settings and change the criteria so that the study contains data. (i.e. different dates, streets, id's, routes, etc.) A common problem is a time period without data, so be sure to include a valid date range.
You'll notice that the page you are on contains several tabs. The one you are currently working in is the green settings tab. Click the blue "Study Report" tab. You will now be presented with a report showing you some basic information about the data you have selected.
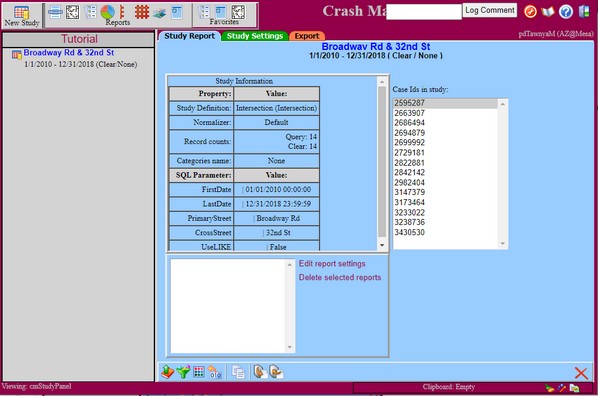
For the purposes of this tutorial, it is best to have a query with 5 to 75 crashes in it.
Now you have your first study. Every study and report within that study are saved automatically. So next time you open the program, they will be there for you. At this point, you can always click/activate the study from the tree on the left, and make any changes desired in the study on the green tab.
Note about using your own safety management system to gather data: In some agencies, the data selection is done by your own in-house system. Your safety management system has a link, or button that you can click on to "send" the data to Crash Magic. In this case, you will not click on a study template button for this tutorial step, but rather, you should now log into your safety management system and request that it send a selection of crashes to Crash Magic. Please see your internal documentation for more information on this step. Depending on how your system was written, you may jump to the end of this step, or all the way to a new diagram or chart.
See also: Studies, Questions about studies