Under each study, there can be any number of reports. A report is information displayed based on the study. A simple report might show the number of crash records found in a query. A more complex report might calculate the cost of the crashes in a study.
Crash Magic is capable of producing many types of reports. It is also possible to create customized reports as "plug-ins" to Crash Magic.
The "built-in" reports that come with Crash Magic include:
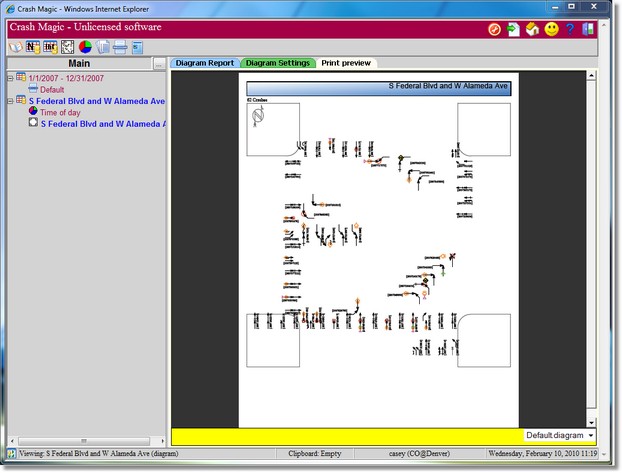
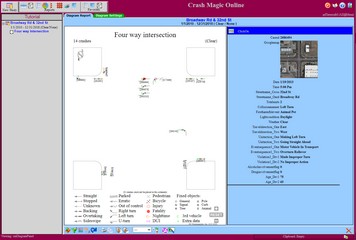
•Collision diagrams with "drill-down" to identify individual crash records
•High crash location lists
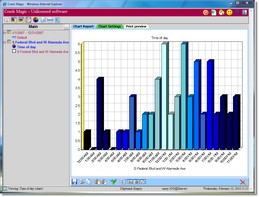
•Bar, pie and line graphs
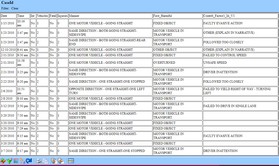
•Crash listings
Whenever a report is created, a new node is added to the project tree to hold the settings for that report. The report content itself is not stored. This is important to note. If a report is created, and the data behind the report changes, the next time that the report is displayed, it will reflect the changed data.
To save a report as it exists today, so that its contents will not change in the future, select the printer icon at the bottom of any report page and save the resulting Adobe Acrobat PDF file to your hard disk.